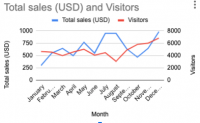
2-axis line charts are useful for representing data where the scales of each series have a large variation. For example, you may want to display two series of data on a chart. One of the series might have numbers in the range of hundreds. The other series may have numbers where the magnitude is in the thousands.
In this tutorial we will create a line chart with two axes, each with their own axis title.

Step 1: Prepare your data
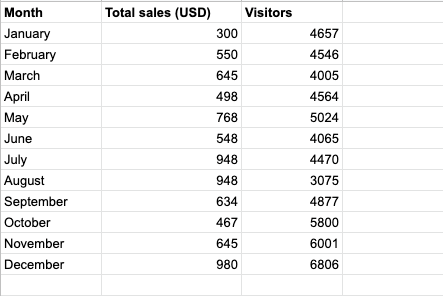
To display display a graph with two data lines you will need three columns. The first column will be your x axis data labels, the second column is your first data set, and the third column is the third data set. Prepare your data in this format, or use the sample data.
Step 2: Insert a line chart
First select the data range for the chart. To do this, drag a selection box from the top left cell, to the bottom right.
Then click Insert > Chart
Step 3: Set the chart type to a line chart

The default chart type is a Stacked column chart. To set the chart to display as a line chart, chose a line chart type from the Chart type selector.
Note: If the Chart editor is not already open, double-click the chart.
Step 4: Add a secondary Y axis
Both data sets display on the same axis, at the same scale. In order to set one of the data columns to display on the right axis, go to the Customize tab. Then open the Series section. The first series is already set correctly to display on the left axis. Choose the second data series dropdown, and set its axis to Right axis.
Step 5: Add a left and right axis title

Now we have two axes displaying on the chart. In order to identify which axis corresponds to which series, we will add a title for each one.
In the Chart & axis titles section, with the Vertical axis title selected, enter the title for the first axis in the Title text field.
To set the title for the second axis, select the Right vertical axis title from the selector, and enter the title in the Title text field.
Related tutorials